The core change to our design pipeline I mentioned last week was the incorporation of more testing. The idea is that building confidence in our level design through testing will save us a lot of work in the long run and also help establish clear goals for design as we wrap up production. As part of this new effort, we've written some new test procedures and I've also worked on some stats gathering. I want to explain that a little more clearly in this blog post.
Some Definitions
Creator / Designer: The person who built the level and will make changes to it
Observer: The person administering the test, taking notes
Player / Participant: The person actually playing the game
1-Record Everything
We used to rely on handwritten notes or accounts of tests in order to make judgements. The main problem with this is that the creator never gets to see what the player actually did, and has to rely on what the observer has noted (unless they happen to be the same person). This added a lot of subjectivity to the test results and also meant the creator was working blind. You don't really realize how much of a problem this is until you implement the solution: Record Everything.
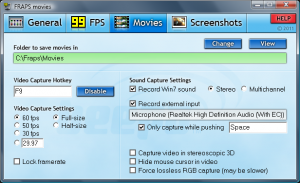
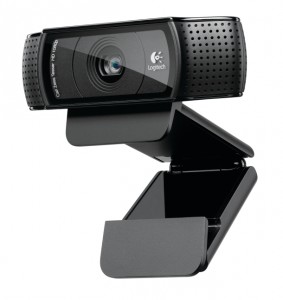
Hard Drives these days are cheap and we all have plenty of disk space. With tools like FRAPS and a run-of-the-mill webcam, you can gather a ton of data on someone playing. In our case we use the webcam to record the player's facial expressions and we use FRAPS to record the game itself.
Instead of relying on notes and accounts from observers, I'm now advising that everyone on the team record their playtests. The creator is able to review the video himself (at 2x or 4x speed to save time) and our observers no longer need to take notes and can instead interrogate the player about what they are thinking. There have already been instances where a player has solved a puzzle in an unintended way, and the creator never would have known from the observer's notes. Having the video on hand makes everything simpler.
2-Data Gathering
Part of the new test procedure involved a data-sheet on the player. We wanted to know who the player was, what skill level of gamer they considered themselves to be, what platforms they used, etc. This data would help us make important design decisions. Along with this player info, we also wanted to gather data on the gameplay itself. How long did a player spend as Envy? How many times did they die? This is doable using our recorded video, but unfortunately it's pretty tedious.
This week, I automated this process using a quick-and-easy PHP service and some C# WebClient calls from the game. The game client now sends hundreds of events every minute and they get stored in a central database. We can use this data to easily calculate how much time a player spends as each sin, or how many times they died. We can even cross-tab this data by location and find the hot spots or time-consuming parts of the game.
The message format is fairly simple. The game sends event, each event containing the timestamp, current location and sin of the player that sent it, as well as an event type and detail field. This gets dumped into a MySQL database by a PHP script. I found out early on that spamming our web-server every few seconds is bad, so I implemented event batching.
Here is the source code for the PHP service. You can guess that the C# side of things is fairly simple. The code uses the UploadValuesAsync method to pass along parameters whenever there is an event we want to track.
3-Analysis
Now we're sitting on a ton of data, but we need to analyze it somehow. This is the step I'm at now. I've downloaded RapidMiner and started analyzing the data. I have a background in Business Intelligence so this isn't completely new to me, but game data has some new challenges.
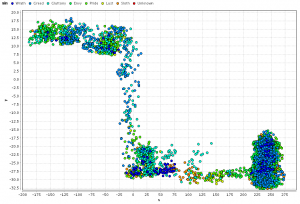
Here is what a test run of hell3 looks like in RapidMiner. As you can see the boss near the end has a much higher point density. This is because players kept dying to the Narwhal!
The main information I want to get out of our test runs are reports like:
- Percentage of time spent as each sin
- # of deaths by location
- # of deaths by sin
- Average time spent at specific puzzles
- Average time spent at battles
- Average time to complete a level
- Location of jumps leading to deaths
I'll be working on producing these types of reports in the next few days and will let you all know how it's going!
Dan


Great post! Some indie developers don't realize the importance of testing, test data collection, and statistical analysis on the test data. It can be a lot of work but it will help the developer make better decisions about the design. It's very important!
Your Business Intelligence background is really paying off. We've been running some playtest sessions on my own project, but nothing even half as sophisticated as this. I'll definitely be shoving this article under the noses of the rest of my team.
More, please!